- 201부터 #250까지의 범위에서 50개의 결과가 아래에 보입니다.
-
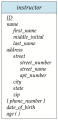 ErModelComposite.png 570 × 1,182; 122 KB
-
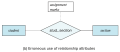 Erroneous use of relationship attibutes.png 986 × 429; 49 KB
-
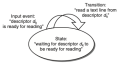
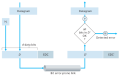 Error-detection-correction scenario.png 577 × 362; 33 KB
-
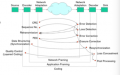 ErrorControl.png 486 × 302; 67 KB
-
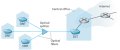
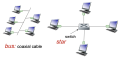 Ethernet- physical topology.png 1,474 × 698; 259 KB
-
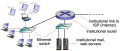 Ethernet.png 1,506 × 640; 228 KB
-
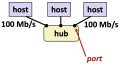 Ethernet segment.png 914 × 488; 48 KB
-
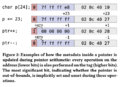
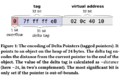 EuroSys 2018 Delta Pointers Figure 1.png 752 × 489; 83 KB
-
 EuroSys 2018 Delta Pointers Figure 2.png 775 × 562; 95 KB
-
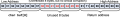 Example Input "0123456789ABCDE".png 2,494 × 362; 108 KB
-
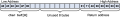
 Example Input "0123456789ABCDEF".png 2,494 × 422; 118 KB
-
 Example Input "Hello".png 2,494 × 362; 85 KB
-
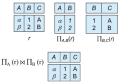 Example of Lossless Decomposition.png 532 × 366; 86 KB
-
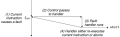
 Exec system call.png 924 × 745; 346 KB
-
 Exercise -1.png 1,211 × 430; 51 KB
-
 Explicit Congestion Notification.png 930 × 530; 131 KB
-
 Extended page table.png 1,014 × 670; 85 KB
-
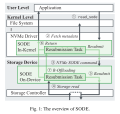 FAST 2025 SODE.png 722 × 684; 109 KB
-
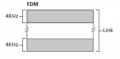 FDM.png 385 × 188; 15 KB
-
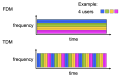 FDMTDM.png 1,504 × 966; 88 KB
-
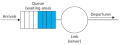 FIFO queueing abstraction model.png 782 × 296; 46 KB
-
 FSM for concurrent event-based echo server.png 370 × 208; 29 KB
-
 FTTH.png 1,346 × 566; 159 KB
-
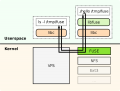 FUSE structure.png 1,920 × 1,454; 96 KB
-
 Fault FLow.png 1,210 × 370; 142 KB
-
 Fd set setting by FD SET.png 744 × 162; 19 KB
-
 Fd set setting by FD ZERO.png 704 × 162; 18 KB
-
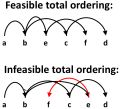 Feasible order.jpg 804 × 729; 164 KB
-
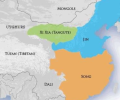 Figure 1. 13세기 분열된 중국 지도.png 686 × 572; 344 KB
-
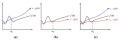 Figure 1. Big Oh, Omega, Theta.png 576 × 191; 33 KB
-
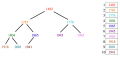 Figure 1. Binary Heaps.png 691 × 326; 34 KB
-
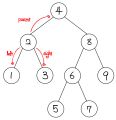 Figure 1. Binary Search Tree.jpg 750 × 774; 124 KB
-
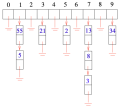 Figure 1. Chaining Hash Table.png 436 × 394; 19 KB
-
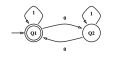 Figure 1. DFA example.png 479 × 235; 19 KB
-
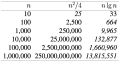 Figure 1. Difference between O(n) and O(n log(n)).png 834 × 428; 51 KB
-
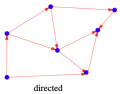 Figure 1. Directed Graph.png 357 × 280; 15 KB
-
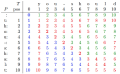 Figure 1. Example of DP Table.png 656 × 406; 204 KB
-
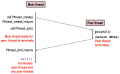 Figure 1. Execution of Threaded “hello, world”.png 2,330 × 1,436; 262 KB
-
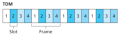 Figure 1. Four node TDM example.png 692 × 204; 30 KB
-
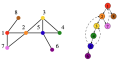 Figure 1. Graph to DFS tree.png 505 × 257; 26 KB
-
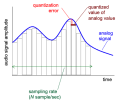 Figure 1. Multimedia- audio.png 459 × 395; 34 KB
-
 Figure 1. NFA example .png 902 × 173; 22 KB
-
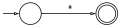 Figure 1. NFA for .png 471 × 110; 10 KB
-
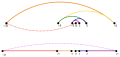 Figure 1. Nearest Neighbor Tour is Wrong.png 595 × 284; 29 KB
-
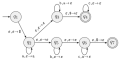 Figure 1. PDA Example 1.png 631 × 322; 59 KB
-
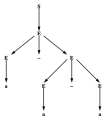 Figure 1. Parse Trees Example 1.png 316 × 354; 11 KB
-
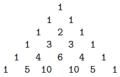 Figure 1. Pascal’s Triangle.png 381 × 245; 46 KB
-
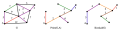 Figure 1. Prim’s Algorithm in Action.png 1,041 × 268; 41 KB
-
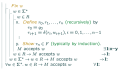 Figure 1. Proof of 3(a).png 952 × 554; 91 KB
-
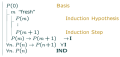 Figure 1. Proofs by Induction.png 806 × 380; 53 KB


_and_O(n_log(n)).png)


.png)
